 Amir Tadrisi
In this tutorial, you'll learn how to build a real-time analytics dashboard using FastAPI and Svelte. We'll use server-sent events (SSE) to stream live data updates from FastAPI to our Svelte frontend, creating an interactive dashboard that updates in real-time.
Final app:
Dependencies:
- Svelte v5.23.2
- SvelteKit v2.19.0
- Node v22.14.0
- npm v11.2.0
- FastAPI v0.115.11
- Python v3.13.2
Contents
Objectives
By the end of this tutorial, you should be able to:
- Set up a FastAPI backend with real-time data streaming capabilities
- Create a modern Svelte application using SvelteKit
- Implement server-sent events (SSE) for real-time data updates
- Build interactive charts and graphs with Svelte components
- Handle real-time data updates efficiently in the frontend
What Are We Building?
We'll create an analytics dashboard that displays mock sensor data in real-time. The dashboard will include:
- A line chart showing temperature trends
- A gauge chart displaying current humidity levels
- Real-time status indicators
- Historical data view
This is a practical example that can be adapted for any application requiring real-time data visualization.
Project Setup
Let's start by creating our project structure, open a terminal and run the following commands:
$ mkdir svelte-fastapi-dashboard
$ cd svelte-fastapi-dashboard
We'll organize our project with two main directories:
svelte-fastapi-dashboard/
├── backend/
└── frontend/
Let's begin with the backend setup...
FastAPI Backend
First, let's set up our backend environment. Create and navigate to the backend directory:
$ mkdir backend
$ cd backend
Create and activate a virtual environment:
$ python -m venv venv
$ source venv/bin/activate
$ export PYTHONPATH=$PWD
Install the required dependencies:
(venv)$ pip install fastapi==0.115.11 uvicorn==0.34.0 sse-starlette==2.2.1
We're using sse-starlette for server-sent events support in FastAPI.
Create the following directory structure in the "backend" folder:
backend/
├── app/
│   ├── __init__.py
│   ├── api.py
│   └── sensor.py
└── main.py
Let's implement a mock sensor data generator in backend/app/sensor.py:
import random
from datetime import datetime
from typing import Dict


class SensorData:
    def __init__(self):
        self.min_temp = 18.0
        self.max_temp = 26.0
        self.min_humidity = 30.0
        self.max_humidity = 65.0

    def generate_reading(self) -> Dict:
        """Generate a mock sensor reading."""
        return {
            "timestamp": datetime.now().isoformat(),
            "temperature": round(random.uniform(self.min_temp, self.max_temp), 1),
            "humidity": round(random.uniform(self.min_humidity, self.max_humidity), 1),
            "status": random.choice(["normal", "warning", "critical"])
        }
Now, let's create our FastAPI application in backend/app/api.py:
import asyncio
import json

from fastapi import FastAPI
from fastapi.middleware.cors import CORSMiddleware
from sse_starlette.sse import EventSourceResponse

from .sensor import SensorData


app = FastAPI()
sensor = SensorData()


# Configure CORS
app.add_middleware(
    CORSMiddleware,
    allow_origins=["http://localhost:5173"],  # Svelte dev server
    allow_credentials=True,
    allow_methods=["*"],
    allow_headers=["*"],
)


@app.get("/")
async def root():
    return {"message": "Welcome to the Sensor Dashboard API"}


@app.get("/current")
async def get_current_reading():
    """Get the current sensor reading."""
    return sensor.generate_reading()


@app.get("/stream")
async def stream_data():
    """Stream sensor data using server-sent events."""
    async def event_generator():
        while True:
            data = sensor.generate_reading()
            yield {
                "event": "sensor_update",
                "data": json.dumps(data)
            }
            await asyncio.sleep(2)  # Update every 2 seconds

    return EventSourceResponse(event_generator())
In this section, we've created a FastAPI application that streams sensor data using server-sent events (SSE). The /current endpoint returns the current sensor reading, and the /stream endpoint streams sensor data updates in real-time.
Finally, create the entry point in backend/main.py:
import uvicorn


if __name__ == "__main__":
    uvicorn.run("app.api:app", host="0.0.0.0", port=8000, reload=True)
Start the server:
(venv)$ python main.py
Your API should now be running at http://localhost:8000. You can check the API documentation at http://localhost:8000/docs. After visiting the http://localhost:8000 you should see the following output:
{
"message": "Welcome to the Sensor Dashboard API"
}
Svelte Frontend
Now let's create our Svelte application using SvelteKit. Navigate back to the project root and create the frontend:
$ cd ..
$ npx [email protected] create frontend
When prompted, select the following options:
- Which template would you like? › SvelteKit minimal
- Add type checking with TypeScript? › Yes, using TypeScript syntax
- What would you like to add to your project? (use arrow keys/space bar):
- ✓ prettier
- ✓ eslint
- ✓ vitest
- Which package manager do you want to install dependencies with? › npm
Install the dependencies:
$ cd frontend
$ npm install
We'll also need some additional packages for our dashboard:
$ npm install [email protected] @types/[email protected]
Let's create our main dashboard layout. Replace the contents of frontend/src/routes/+page.svelte with:
<script lang="ts">
import { onMount } from 'svelte';
import type { SensorReading } from '$lib/types';
let currentReading = $state<SensorReading | null>(null);
let eventSource = $state<EventSource | undefined>(undefined);
onMount(async () => {
// Initial data fetch
const response = await fetch('http://localhost:8000/current');
currentReading = await response.json();
// Set up SSE connection
eventSource = new EventSource('http://localhost:8000/stream');
eventSource.addEventListener('sensor_update', (event) => {
currentReading = JSON.parse(event.data);
});
return () => {
if (eventSource) eventSource.close();
};
});
</script>
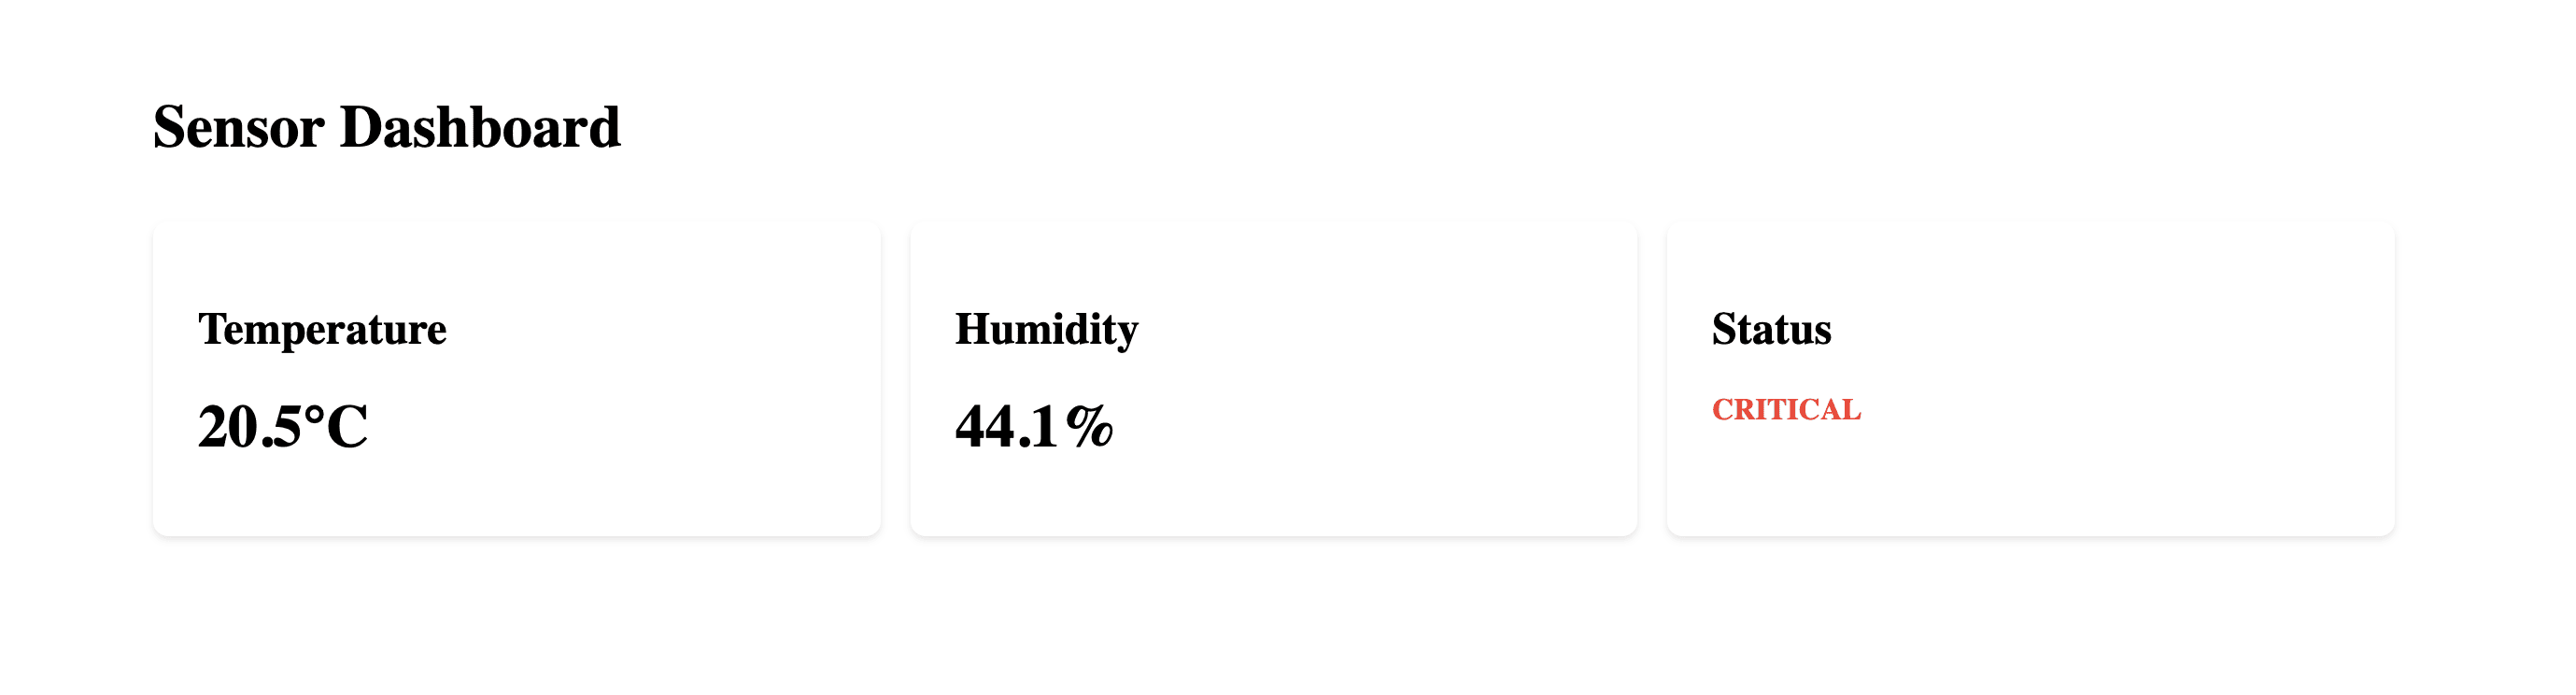
<main class="container">
<h1>Sensor Dashboard</h1>
{#if currentReading}
<div class="dashboard-grid">
<div class="card">
<h2>Temperature</h2>
<p class="reading">{currentReading.temperature}°C</p>
</div>
<div class="card">
<h2>Humidity</h2>
<p class="reading">{currentReading.humidity}%</p>
</div>
<div class="card">
<h2>Status</h2>
<p class="status {currentReading.status}">{currentReading.status}</p>
</div>
</div>
{/if}
</main>
<style>
.container {
max-width: 1200px;
margin: 0 auto;
padding: 2rem;
}
.dashboard-grid {
display: grid;
grid-template-columns: repeat(auto-fit, minmax(300px, 1fr));
gap: 1rem;
margin-top: 2rem;
}
.card {
background: #fff;
padding: 1.5rem;
border-radius: 8px;
box-shadow: 0 2px 4px rgba(0,0,0,0.1);
}
.reading {
font-size: 2rem;
font-weight: bold;
margin: 1rem 0;
}
.status {
text-transform: uppercase;
font-weight: bold;
}
.status.normal { color: #2ecc71; }
.status.warning { color: #f1c40f; }
.status.critical { color: #e74c3c; }
</style>
Create a new file frontend/src/lib/types.ts to define our types:
export interface SensorReading {
  timestamp: string;
  temperature: number;
  humidity: number;
  status: 'normal' | 'warning' | 'critical';
}
With the backend running in one terminal window, start the Svelte development server:
$ npm run dev
Your dashboard should now be accessible at http://localhost:5173, showing real-time sensor data updates!
What's happening in this code?
- Component Structure: The dashboard component follows a typical Svelte structure with three main sections:
- Script (logic)
- Template (HTML)
- Style (CSS)
- Data Management
- Uses TypeScript for type safety
- Maintains two key pieces of state:
currentReading: Stores the latest sensor dataeventSource: Manages the real-time connection
- Real-time Data Flow:
- Initial Load: Fetches current sensor data when component mounts
- Live Updates: Establishes SSE connection for real-time updates
- Cleanup: Properly closes connection when component is destroyed
The temperature, humidity, and status are pulled from the backend from values defined in sensor.py and shown in the dashboard.
Real-time Charts
Let's enhance our dashboard with interactive charts using Chart.js. First, create a new components directory:
$ mkdir src/lib/components
Create a new component for our temperature chart in frontend/src/lib/components/TemperatureChart.svelte:
<script lang="ts">
  import { onMount } from 'svelte';
  import Chart from 'chart.js/auto';
  import type { SensorReading } from '$lib/types';

  const { data } = $props<{ data: SensorReading[] }>();
  let canvas: HTMLCanvasElement;
  let chart = $state<Chart | undefined>(undefined);

  $effect(() => {
    if (chart && data) {
      chart.data.labels = data.map(reading => {
        const date = new Date(reading.timestamp);
        return date.toLocaleTimeString();
      });
      chart.data.datasets[0].data = data.map(reading => reading.temperature);
      chart.update();
    }
  });

  onMount(() => {
    chart = new Chart(canvas, {
      type: 'line',
      data: {
        labels: [],
        datasets: [{
          label: 'Temperature (°C)',
          data: [],
          borderColor: '#3498db',
          tension: 0.4,
          fill: false
        }]
      },
      options: {
        responsive: true,
        animation: {
          duration: 0 // Disable animations for real-time updates
        },
        scales: {
          y: {
            beginAtZero: false,
            suggestedMin: 15,
            suggestedMax: 30
          }
        }
      }
    });

    return () => {
      if (chart) chart.destroy();
    };
  });
</script>

<canvas bind:this={canvas}></canvas>
This component creates a real-time temperature line chart using Chart.js. When mounted, it initializes an empty chart with the appropriate styling and scale settings. The reactive statement, ($:), watches for changes in the data array, automatically updating the chart with new temperature readings and converting timestamps to readable time formats.
Create a similar component for humidity in frontend/src/lib/components/HumidityGauge.svelte:
<script lang="ts">
  import { onMount } from 'svelte';
  import Chart from 'chart.js/auto';

  const { value } = $props<{ value: number }>();
  let canvas: HTMLCanvasElement;
  let chart = $state<Chart | undefined>(undefined);

  $effect(() => {
    if (chart && value !== undefined) {
      chart.data.datasets[0].data = [value];
      chart.update();
    }
  });

  onMount(() => {
    chart = new Chart(canvas, {
      type: 'doughnut',
      data: {
        datasets: [{
          data: [value],
          backgroundColor: ['#2ecc71'],
          circumference: 180,
          rotation: 270,
        }]
      },
      options: {
        responsive: true,
        maintainAspectRatio: false,
        plugins: {
          tooltip: {
            enabled: false
          }
        }
      }
    });

    return () => {
      if (chart) chart.destroy();
    };
  });
</script>

<div class="gauge-container">
  <canvas bind:this={canvas}></canvas>
  <div class="gauge-value">{value}%</div>
</div>

<style>
  .gauge-container {
    position: relative;
    height: 200px;
  }

  .gauge-value {
    position: absolute;
    bottom: 0;
    left: 50%;
    transform: translateX(-50%);
    font-size: 1.5rem;
    font-weight: bold;
  }
</style>
In this section, we created a gauge chart component using Svelte 5's runes. The component uses $props() to declare its properties and $state() for reactive state management. The $effect() rune replaces the traditional reactive statement to update the chart when the value changes. By using Chart.js' doughnut type with custom configuration (circumference: 180, rotation: 270), we've created a semi-circular gauge that displays the current humidity value.
Now, let's update our main page to include historical data and the new chart components. Update frontend/src/routes/+page.svelte:
<script lang="ts">
import { onMount } from 'svelte';
import TemperatureChart from '$lib/components/TemperatureChart.svelte';
import HumidityGauge from '$lib/components/HumidityGauge.svelte';
import type { SensorReading } from '$lib/types';
let currentReading = $state<SensorReading | null>(null);
let historicalData = $state<SensorReading[]>([]);
let eventSource = $state<EventSource | undefined>(undefined);
onMount(async () => {
// Initial data fetch
const response = await fetch('http://localhost:8000/current');
currentReading = await response.json();
historicalData = [currentReading];
// Set up SSE connection
eventSource = new EventSource('http://localhost:8000/stream');
eventSource.addEventListener('sensor_update', (event) => {
currentReading = JSON.parse(event.data);
historicalData = [...historicalData, currentReading].slice(-30); // Keep last 30 readings
});
return () => {
if (eventSource) eventSource.close();
};
});
</script>
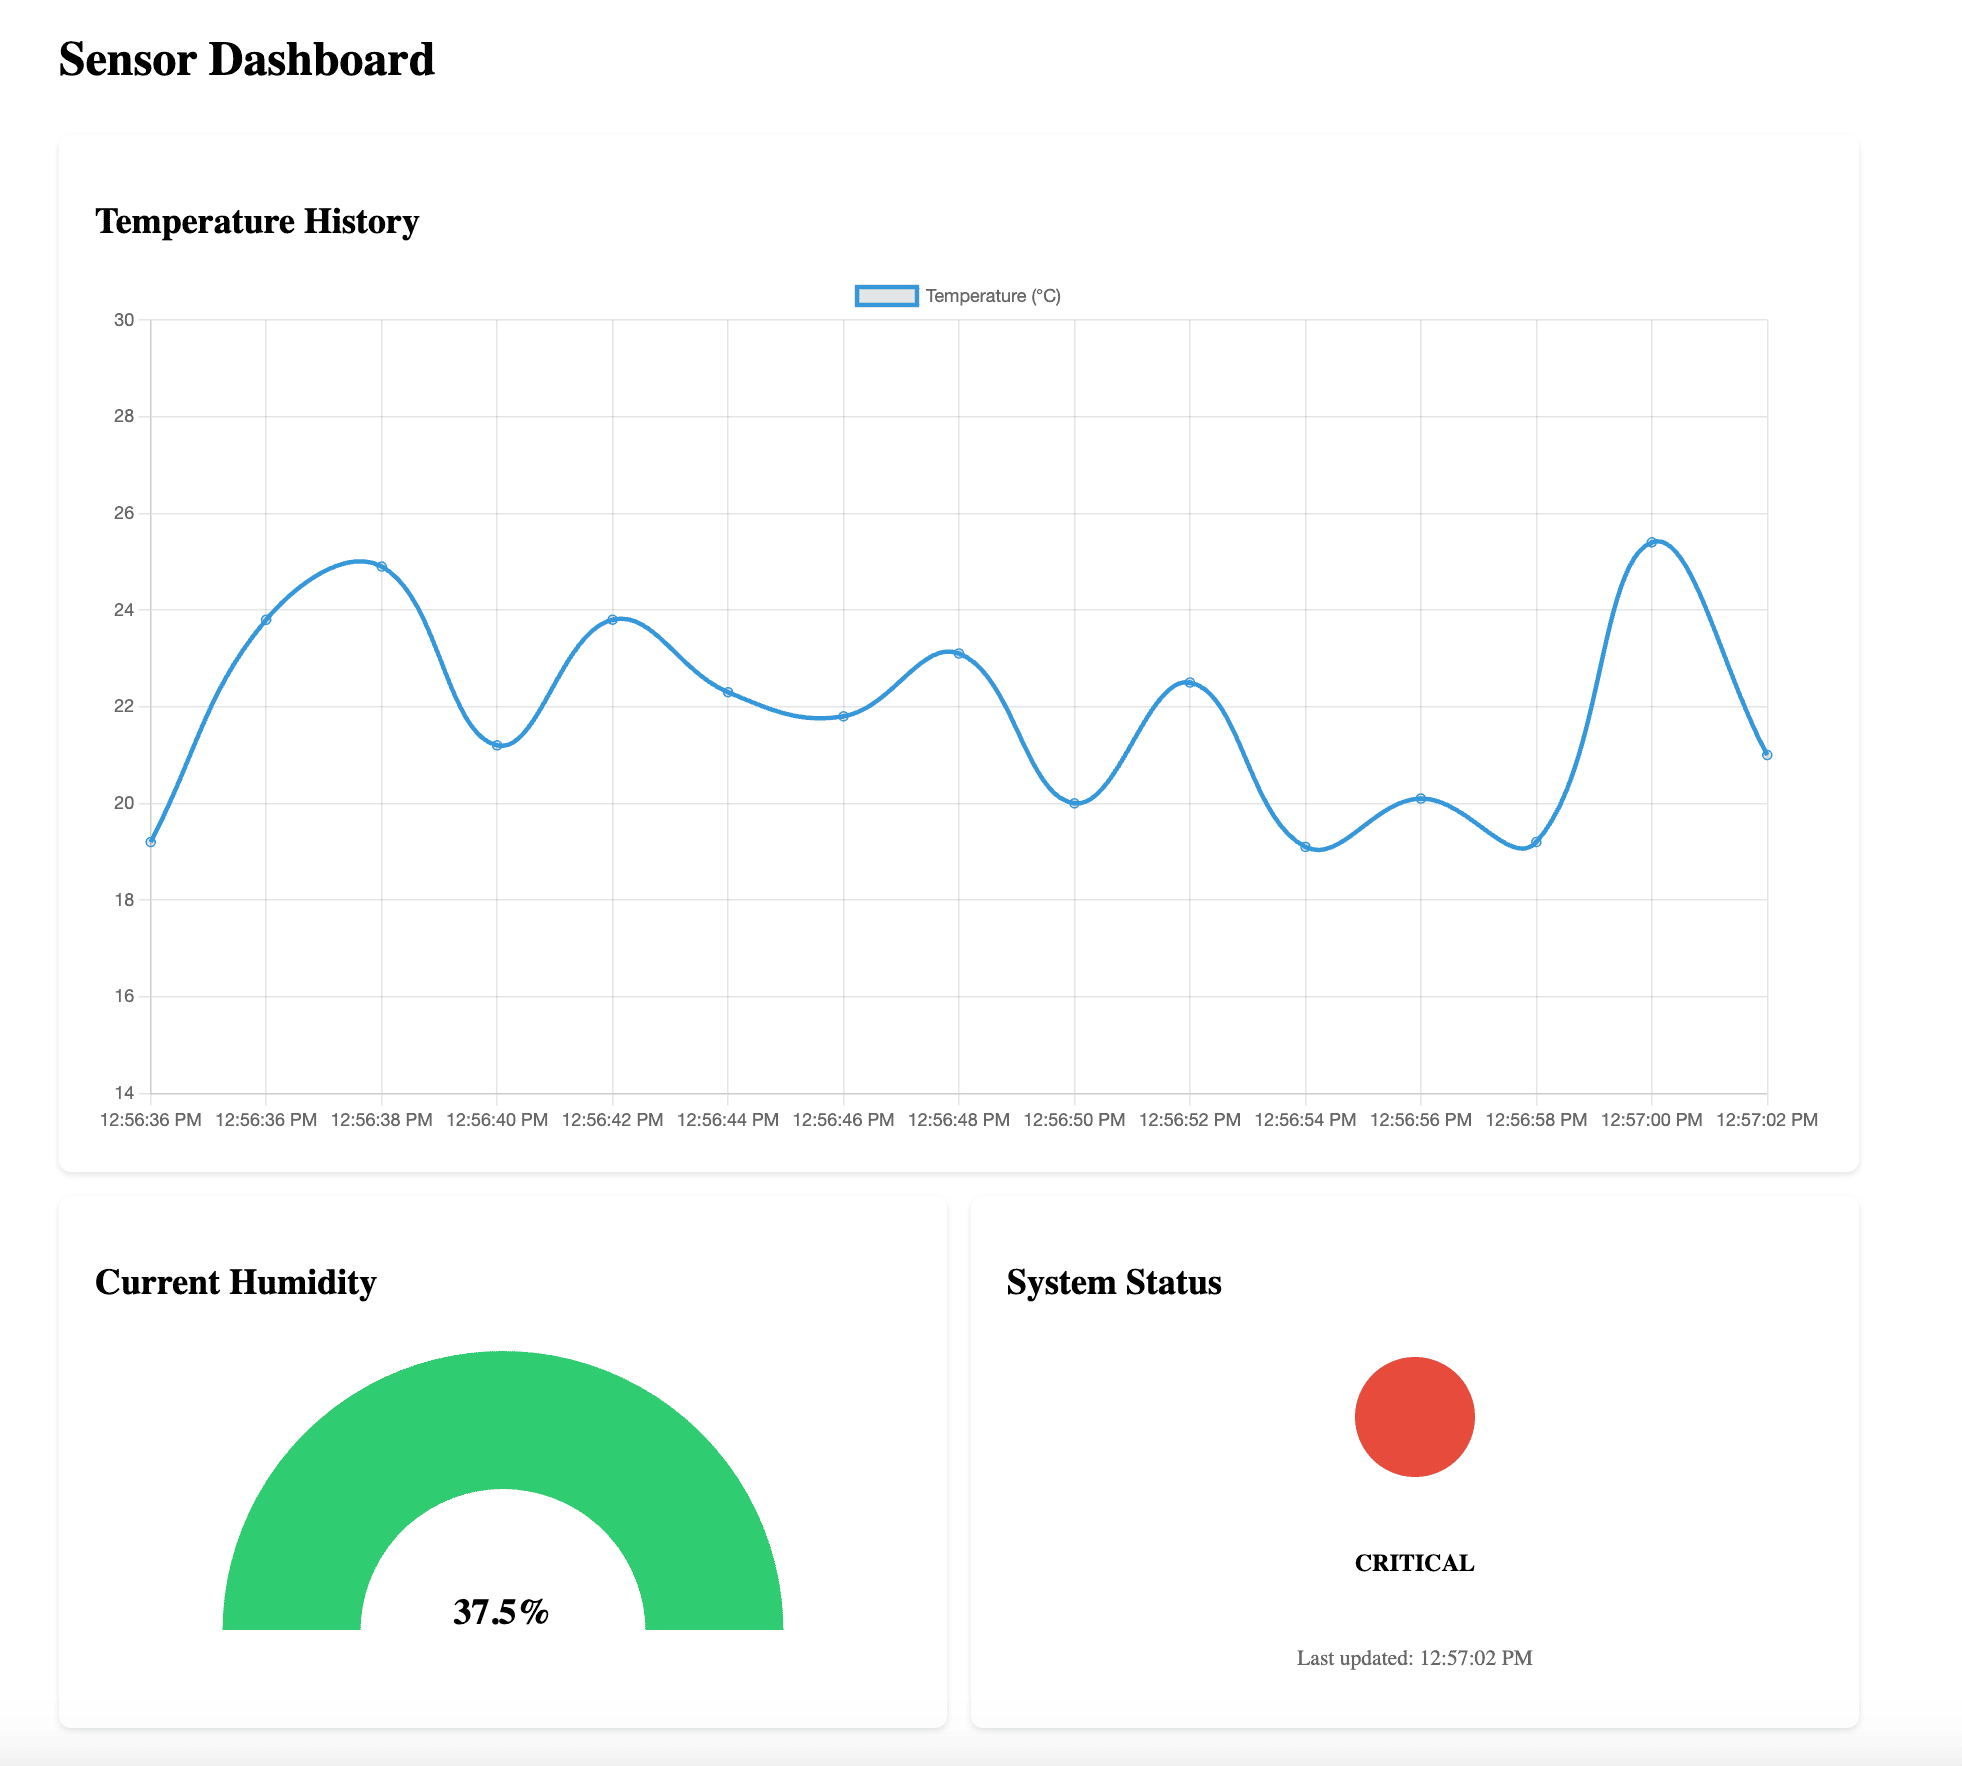
<main class="container">
<h1>Sensor Dashboard</h1>
{#if currentReading}
<div class="dashboard-grid">
<div class="card span-2">
<h2>Temperature History</h2>
<TemperatureChart data={historicalData} />
</div>
<div class="card">
<h2>Current Humidity</h2>
<HumidityGauge value={currentReading.humidity} />
</div>
<div class="card">
<h2>System Status</h2>
<div class="status-container">
<div class="status-indicator {currentReading.status}"></div>
<p class="status-text">{currentReading.status}</p>
<p class="timestamp">Last updated: {new Date(currentReading.timestamp).toLocaleTimeString()}</p>
</div>
</div>
</div>
{/if}
</main>
<style>
.container {
max-width: 1200px;
margin: 0 auto;
padding: 2rem;
}
.dashboard-grid {
display: grid;
grid-template-columns: repeat(2, 1fr);
gap: 1rem;
margin-top: 2rem;
}
.card {
background: #fff;
padding: 1.5rem;
border-radius: 8px;
box-shadow: 0 2px 4px rgba(0,0,0,0.1);
}
.span-2 {
grid-column: span 2;
}
.status-container {
display: flex;
flex-direction: column;
align-items: center;
gap: 1rem;
}
.status-indicator {
width: 80px;
height: 80px;
border-radius: 50%;
margin: 1rem 0;
}
.status-indicator.normal { background-color: #2ecc71; }
.status-indicator.warning { background-color: #f1c40f; }
.status-indicator.critical { background-color: #e74c3c; }
.status-text {
text-transform: uppercase;
font-weight: bold;
}
.timestamp {
color: #666;
font-size: 0.9rem;
}
@media (max-width: 768px) {
.dashboard-grid {
grid-template-columns: 1fr;
}
.span-2 {
grid-column: auto;
}
}
</style>
Now in the browser you should see the following:
Settings and Alerts
Alert Notifications
Let's create a notification system for when sensor values exceed certain thresholds. Create a new component in frontend/src/lib/components/AlertBanner.svelte:
<script lang="ts">
  import { fade } from 'svelte/transition';

  const { message, type = 'warning' } = $props<{
    message: string;
    type?: 'warning' | 'critical'
  }>();
</script>

{#if message}
  <div class="alert {type}" transition:fade>
    <span class="alert-icon">⚠️</span>
    {message}
  </div>
{/if}

<style>
  .alert {
    position: fixed;
    top: 1rem;
    right: 1rem;
    padding: 1rem;
    border-radius: 4px;
    color: white;
    display: flex;
    align-items: center;
    gap: 0.5rem;
    z-index: 1000;
  }

  .warning {
    background-color: #f1c40f;
  }

  .critical {
    background-color: #e74c3c;
  }

  .alert-icon {
    font-size: 1.2rem;
  }
</style>
The AlertBanner component implements conditional UI rendering using Svelte's {#if} block pattern to toggle alert visibility. When there is an alert message, the component displays a banner with an icon and a message.
Settings Panel
Finally, let's add a settings panel to configure alert thresholds in frontend/src/lib/components/SettingsPanel.svelte:
<script lang="ts">
  import { fade } from 'svelte/transition';

  const props = $props<{
    tempThreshold?: number;
    humidityThreshold?: number;
    onTempChange?: (value: number) => void;
    onHumidityChange?: (value: number) => void;
  }>();

  let localTempThreshold = $state(props.tempThreshold ?? 25);
  let localHumidityThreshold = $state(props.humidityThreshold ?? 60);
  let isOpen = $state(false);

  function updateSettings() {
    // Send values back to parent
    props.onTempChange?.(localTempThreshold);
    props.onHumidityChange?.(localHumidityThreshold);
    isOpen = false;
  }
</script>

<div class="settings-container">
  <button class="settings-button" on:click={() => isOpen = !isOpen}>
    ⚙️ Settings
  </button>

  {#if isOpen}
    <div class="settings-panel" transition:fade>
      <h3>Alert Thresholds</h3>
      <div class="setting-group">
        <label>
          Temperature (°C)
          <input type="number" bind:value={localTempThreshold} min="0" max="40" step="0.5">
        </label>
      </div>
      <div class="setting-group">
        <label>
          Humidity (%)
          <input type="number" bind:value={localHumidityThreshold} min="0" max="100" step="5">
        </label>
      </div>
      <div class="button-group">
        <button class="cancel" on:click={() => isOpen = false}>Cancel</button>
        <button class="save" on:click={updateSettings}>Save</button>
      </div>
    </div>
  {/if}
</div>

<style>
  .settings-container {
    position: fixed;
    bottom: 1rem;
    right: 1rem;
    z-index: 1000;
  }

  .settings-button {
    background: #2c3e50;
    color: white;
    border: none;
    padding: 0.5rem 1rem;
    border-radius: 4px;
    cursor: pointer;
    transition: background-color 0.2s;
  }

  .settings-button:hover {
    background: #34495e;
  }

  .settings-panel {
    position: absolute;
    bottom: 100%;
    right: 0;
    background: white;
    padding: 1.5rem;
    border-radius: 8px;
    box-shadow: 0 2px 8px rgba(0,0,0,0.2);
    margin-bottom: 0.5rem;
    min-width: 280px;
    color: #2c3e50;
  }

  h3 {
    margin: 0 0 1rem 0;
    font-size: 1.2rem;
    color: #2c3e50;
  }

  .setting-group {
    margin: 1rem 0;
  }

  label {
    display: flex;
    flex-direction: column;
    gap: 0.5rem;
    font-size: 0.9rem;
    color: #34495e;
  }

  input {
    padding: 0.5rem;
    border: 1px solid #ddd;
    border-radius: 4px;
    font-size: 1rem;
    width: 100%;
  }

  input:focus {
    outline: none;
    border-color: #3498db;
    box-shadow: 0 0 0 2px rgba(52, 152, 219, 0.2);
  }

  .button-group {
    display: flex;
    justify-content: flex-end;
    gap: 0.5rem;
    margin-top: 1.5rem;
  }

  .button-group button {
    padding: 0.5rem 1rem;
    border: none;
    border-radius: 4px;
    cursor: pointer;
    font-size: 0.9rem;
    transition: opacity 0.2s;
  }

  .button-group button:hover {
    opacity: 0.9;
  }

  .save {
    background: #2ecc71;
    color: white;
  }

  .cancel {
    background: #95a5a6;
    color: white;
  }
</style>
In the SettingsPanel component, we've implemented a configurable interface for alert threshold management. We're using a callback pattern with the following steps:
- The component receives the current values as props (
tempThreshold,humidityThreshold) - It also receives callback functions (
onTempChange,onHumidityChange) to notify the parent of changes - It maintains its own local state with
$statefor the form inputs - When the user clicks "Save", it calls the callbacks with the updated values
Update the main page, frontend/src/routes/+page.svelte, to include alert handling and the settings panel:
<script lang="ts">
  import { onMount } from 'svelte';
  import TemperatureChart from '$lib/components/TemperatureChart.svelte';
  import HumidityGauge from '$lib/components/HumidityGauge.svelte';
  import SettingsPanel from '$lib/components/SettingsPanel.svelte';
  import AlertBanner from '$lib/components/AlertBanner.svelte';
  import type { SensorReading } from '$lib/types';

  let currentReading = $state<SensorReading | null>(null);
  let historicalData = $state<SensorReading[]>([]);
  let eventSource = $state<EventSource | undefined>(undefined);
  let tempThreshold = $state(25);
  let humidityThreshold = $state(60);
  let alertMessage = $state('');
  let alertType = $state<'warning' | 'critical'>('warning');

  function checkAlertConditions(reading: SensorReading) {
    if (reading.temperature > tempThreshold) {
      alertMessage = `High temperature detected: ${reading.temperature}°C`;
      alertType = 'critical';
    } else if (reading.humidity > humidityThreshold) {
      alertMessage = `High humidity detected: ${reading.humidity}%`;
      alertType = 'warning';
    } else {
      alertMessage = '';
    }
  }

  // Reactive effect to check alerts when thresholds or readings change
  $effect(() => {
    if (currentReading) {
      checkAlertConditions(currentReading);
    }
  });

  onMount(async () => {
    // Initial data fetch
    const response = await fetch('http://localhost:8000/current');
    currentReading = await response.json();
    historicalData = [currentReading];

    // Set up SSE connection
    eventSource = new EventSource('http://localhost:8000/stream');
    eventSource.addEventListener('sensor_update', (event) => {
      currentReading = JSON.parse(event.data);
      historicalData = [...historicalData, currentReading].slice(-30); // Keep last 30 readings
      if (currentReading) {
        checkAlertConditions(currentReading);
      }
    });

    return () => {
      if (eventSource) eventSource.close();
    };
  });
</script>

<AlertBanner message={alertMessage} type={alertType} />

<main class="container">
  <h1>Sensor Dashboard</h1>

  {#if currentReading}
    <div class="dashboard-grid">
      <div class="card span-2">
        <h2>Temperature History</h2>
        <TemperatureChart data={historicalData} />
      </div>

      <div class="card">
        <h2>Current Humidity</h2>
        <HumidityGauge value={currentReading.humidity} />
      </div>

      <div class="card">
        <h2>System Status</h2>
        <div class="status-container">
          <div class="status-indicator {currentReading.status}"></div>
          <p class="status-text">{currentReading.status}</p>
          <p class="timestamp">Last updated: {new Date(currentReading.timestamp).toLocaleTimeString()}</p>
        </div>
      </div>
    </div>
  {/if}
</main>

<style>
  .container {
    max-width: 1200px;
    margin: 0 auto;
    padding: 2rem;
  }

  .dashboard-grid {
    display: grid;
    grid-template-columns: repeat(2, 1fr);
    gap: 1rem;
    margin-top: 2rem;
  }

  .card {
    background: #fff;
    padding: 1.5rem;
    border-radius: 8px;
    box-shadow: 0 2px 4px rgba(0,0,0,0.1);
  }

  .span-2 {
    grid-column: span 2;
  }

  .status-container {
    display: flex;
    flex-direction: column;
    align-items: center;
    gap: 1rem;
  }

  .status-indicator {
    width: 80px;
    height: 80px;
    border-radius: 50%;
    margin: 1rem 0;
  }

  .status-indicator.normal { background-color: #2ecc71; }
  .status-indicator.warning { background-color: #f1c40f; }
  .status-indicator.critical { background-color: #e74c3c; }

  .status-text {
    text-transform: uppercase;
    font-weight: bold;
  }

  .timestamp {
    color: #666;
    font-size: 0.9rem;
  }

  @media (max-width: 768px) {
    .dashboard-grid {
      grid-template-columns: 1fr;
    }

    .span-2 {
      grid-column: auto;
    }
  }
</style>

<SettingsPanel
  tempThreshold={tempThreshold}
  humidityThreshold={humidityThreshold}
  onTempChange={(value) => tempThreshold = value}
  onHumidityChange={(value) => humidityThreshold = value}
/>
The final dashboard combines all components: temperature history chart, humidity gauge, system status indicator, alert banner, and settings panel.
Your real-time dashboard is now complete with charts, alerts, and configurable settings! The final result should look something like this:
Conclusion
In this tutorial, we've built a real-time dashboard using FastAPI and Svelte. We've covered:
- Setting up a FastAPI backend with SSE for real-time data streaming
- Creating a responsive Svelte frontend with interactive charts
- Implementing real-time data updates and historical data tracking
- Adding an alert system for monitoring threshold violations
- Creating a configurable settings panel
This dashboard can serve as a foundation for more complex monitoring applications. Some potential enhancements could include:
- Adding authentication
- Persisting historical data in a database
- Adding more visualization types
- Implementing websocket communication for bi-directional real-time updates
- Adding export functionality for historical data
The complete source code for this project is available on GitHub.